Avinash Dudani

Data Analyst
How To Create Dynamic (Fiscal/) YTD measures for any selected metric in Power BI ?
Click here to watch this on Youtube!
Open source “Contoso Dataset” to follow along.
Pre-requisite :
- Download the Contoso Sample Data. Restore this database in a Data warehouse ( e.x. MS SQL Server ).
- Create a connection to the database / server in Power BI Desktop and load relevant dimensions and fact tables.
- Create couple of metrics in Power BI Desktop such as: Sales $, Cost $, Profit $, Units Sold etc.
Step 1.
- Create a calculation group called “Time Inteliigence” using Tabular Editor 2 by left-clicking on the “Tables” folder -> “Create New” -> “Calculation Group” or Alternatively, using the shortcut “Alt + 7” .
- Then create the calculation items below:
Calculation Item 1 : Original Value = Selectedmeasure()
Calculation Item 2 : This (Fiscal/) Year  YTD =

Calculate(
    selectedmeasure(), // Metric Value selected in the report
    Datesytd( DimDate[Date], "3/31" )  // Assuming, Fiscal Year is from 1 April to 31 March. If a calendar year is preferred, delete the optional parameter in DatesYTD.
)
Calculation Item 3 : Last (Fiscal/)Year YTD =

var _LY_FYTD =

Calculate
(
        Calculate(
               selectedmeasure(),
               Dateadd( DimDate[Date], -12 , Month) // For Last Year's value
              ),
    Datesytd( DimDate[Date], "3/31" )  // YTD pattern, as shown above
)

var _output =
if(
isblank( selectedmeasure() ),
blank(), // Do not display rows where "This Year's" value is not visible.
_LY_FYTD
)

return

_output
Calculation Item 4 : YTD Variance $ (TY vs LY) =

// leverage previously created calculation item

var _TY_FYTD =
calculate(
selectedmeasure(),
'Test_TimeIntelligence'[Name] = "TY Fiscal YTD"
)

// leverage previously created calculation item

var _LY_FYTD =
calculate(
selectedmeasure(),
'Test_TimeIntelligence'[Name] = "LY Fiscal YTD"
)

var _difference = _TY_FYTD-_LY_FYTD

var _output = if( isblank(_LY_FYTD), blank(), _difference) // do not provide results if there is no LY value, else difference will be skewed

Return
_output
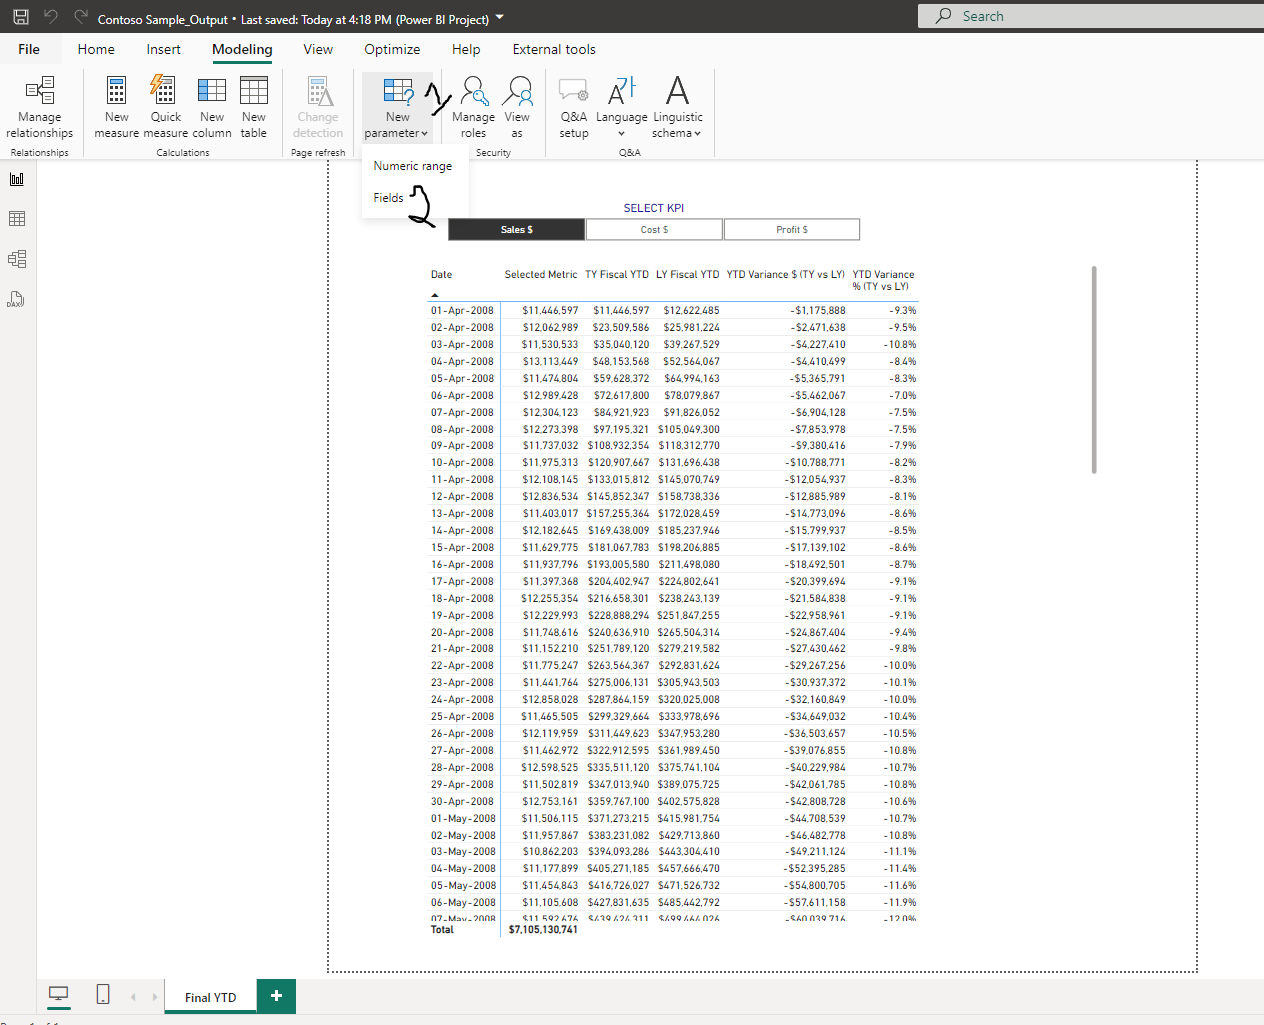
Step 2. Create a Field Parameter called “Metric”:
- Click on the “Modeling” Tab
-
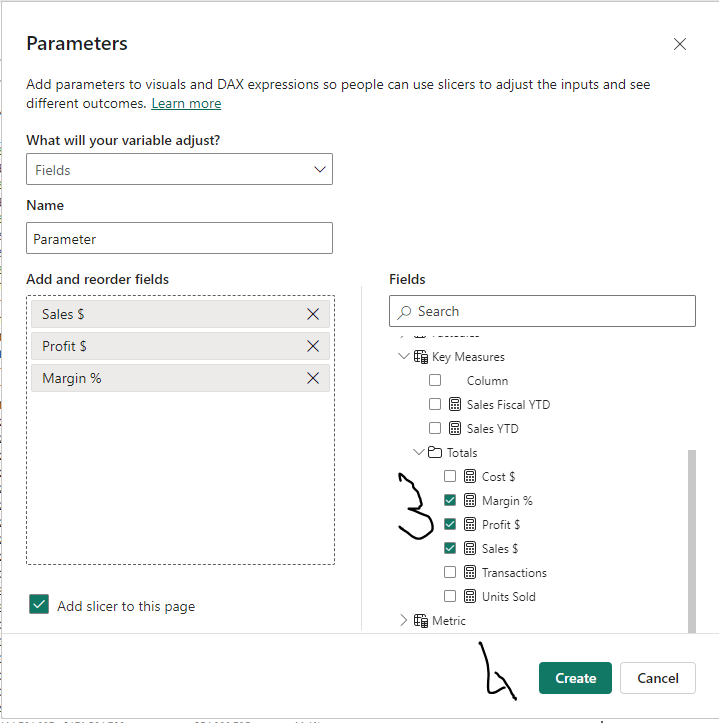
Click on “New parameter” -> “Fields”. /
- Select the metrics you would like to show the YTD measures for.
- Click on create
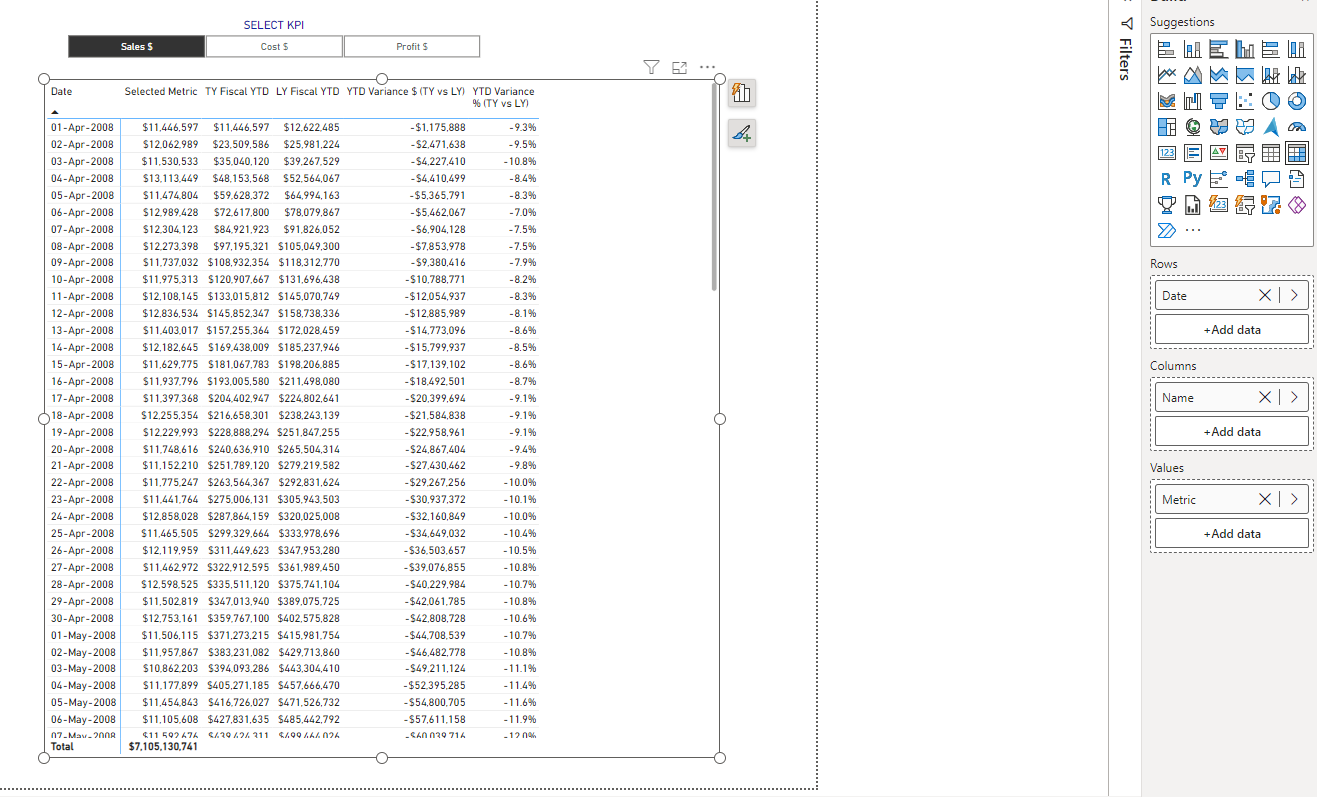
Step 3. Create the visualizations
- Add a slicer with the “Metric” parameter to the and ensure “Single-select” is enforced.
-
In a matrix visual, add: 2.a. “Date” from the Date Dimension to Rows 2.b. “Name” from the Calculation Group into Columns 2.c. “Metric” parameter into Values