Avinash Dudani

Data Analyst
Welcome to Avinash’s Multiple Linear Regression Project
Problem Statement
Multiple linear regression to predict Profit based on Administration spend, Marketing spends, R&D spend and State. Explain the trend and correlation between dependent and independent variables.
Click here to download the raw data and the python code to follow along.
The solution guide is available too.
Solution:
Importing the libraries
import numpy as np
import matplotlib.pyplot as plt
import pandas as pd
import matplotlib.pyplot as plt
import seaborn as sns
Importing the dataset
dataset = pd.read_csv('50_Startups.csv')
Exploratory Data Analysis
Understanding the data
print(dataset.head())  # top 5 rows of the data set'
print(dataset.info()) # general information about the dataset. Fill missing values.
print(dataset.describe()) # summary statistics


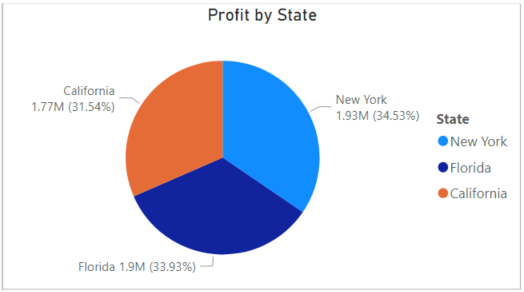
Grouping profit by state
Profitperstate = dataset.groupby('State')['Profit'].mean().sort_values(ascending=False)
print(Profitperstate.head())
Assigning x & y for regression
X = dataset.iloc[:, :-1] #all values from all rows  and all columns excluding the last one
y = dataset.iloc[:, 4] #all values from rows in the last column
#Convert the column into categorical columns
Heatmap Plot to understand correlations
plt.figure(figsize=( 8,8))
sns.heatmap(X.corr(),annot=True, cmap="coolwarm")
states=pd.get_dummies(X['State'],drop_first=True)
Drop the state column
X=X.drop('State',axis=1)
concatenating the dummy variables
X=pd.concat([X,states],axis=1)
Splitting the dataset into the Training set and Test set
from sklearn.model_selection import train_test_split
X_train, X_test, y_train, y_test = train_test_split(X, y, test_size = 0.2, random_state = 0)
Fitting Multiple Linear Regression to the Training set
from sklearn.linear_model import LinearRegression
regressor = LinearRegression()
regressor.fit(X_train, y_train)
Predicting the Test set results i.e. Predicting Profit based on Administration spend, Marketing spend, R&D spend and State.
y_pred = regressor.predict(X_test)
from sklearn.metrics import r2_score
score=r2_score(y_test,y_pred)
print(score)