Avinash Dudani

Data Analyst
Welcome to Avinash’s Sales Analysis Project
Using the Adventure Works Database provided by Microsoft, Sales between 2015-2017 are analyzed. Two versions are displayed below:
- An updated version from 2025 due to enhancements in the Power BI Desktop User Interface
- Watch a demonstration of the the historical project from 2022
Updated Version is shown below and a demonstration to the historical report is linked above
Problem Statements
- Analyze historical KPIs (Sales, Profit, Average order value etc.) over multiple dimensions ( Product, Location, Time etc.).
- Identify bestselling products and the primary locations driving sales growth.
- What were the demographics of the top-selling customers?
Click here to download the updated analysis Power BI Desktop file
Sales Insights
- Overall KPI Highlights and KPI Timeseries
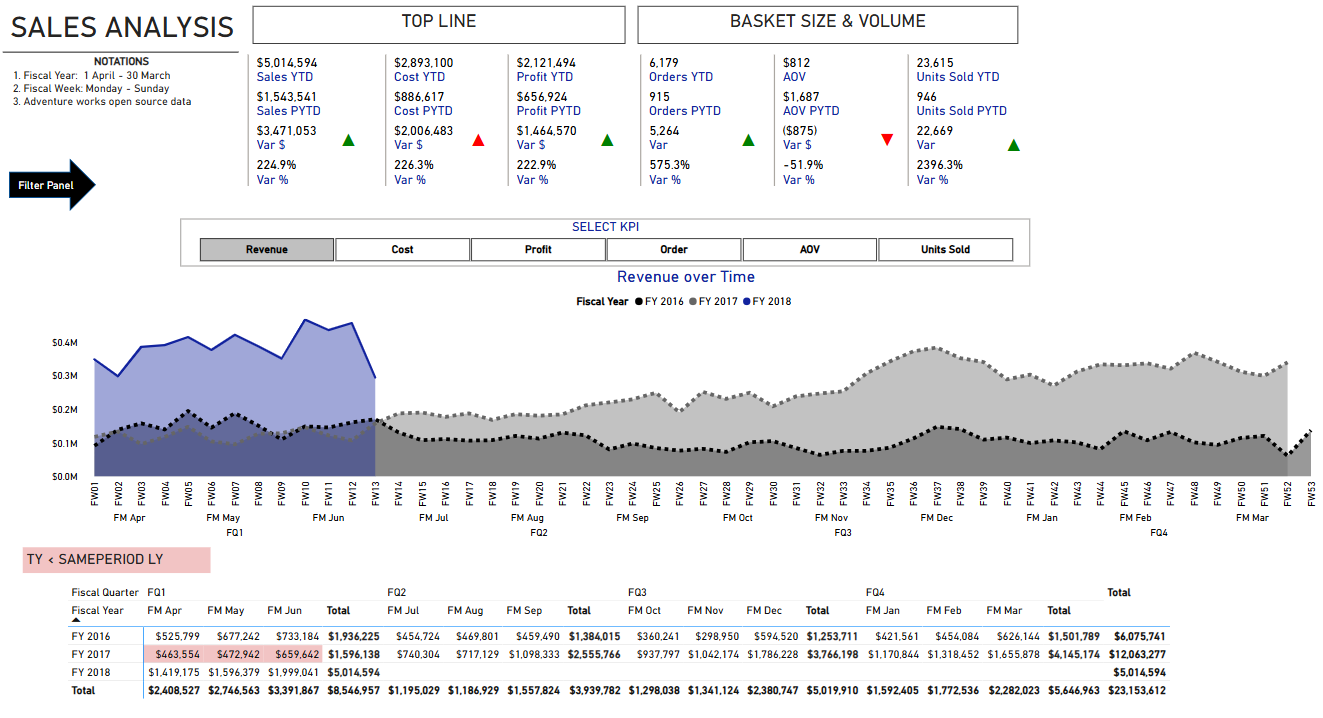
- 4 of the 6 KPIs indicate YTD improvements.
- Cost and Average order value declined TY YTD vs LY YTD
- The time series indicates 3 months of consecutive revenue decline in FY 2017 April - June, versus the same period last year.
- YoY Metric Comparison
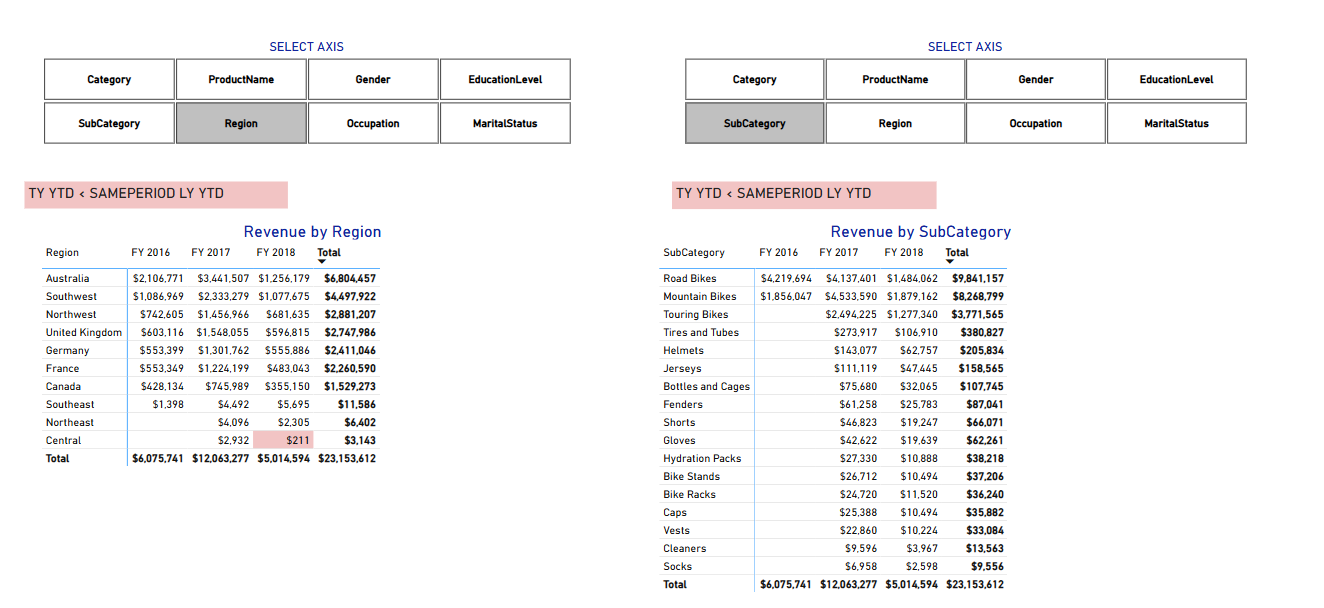
- Central Region indicates a YoY decline in sales in FY 2018, whereas all sub categories had revenue growth YoY
- Pareto Analysis
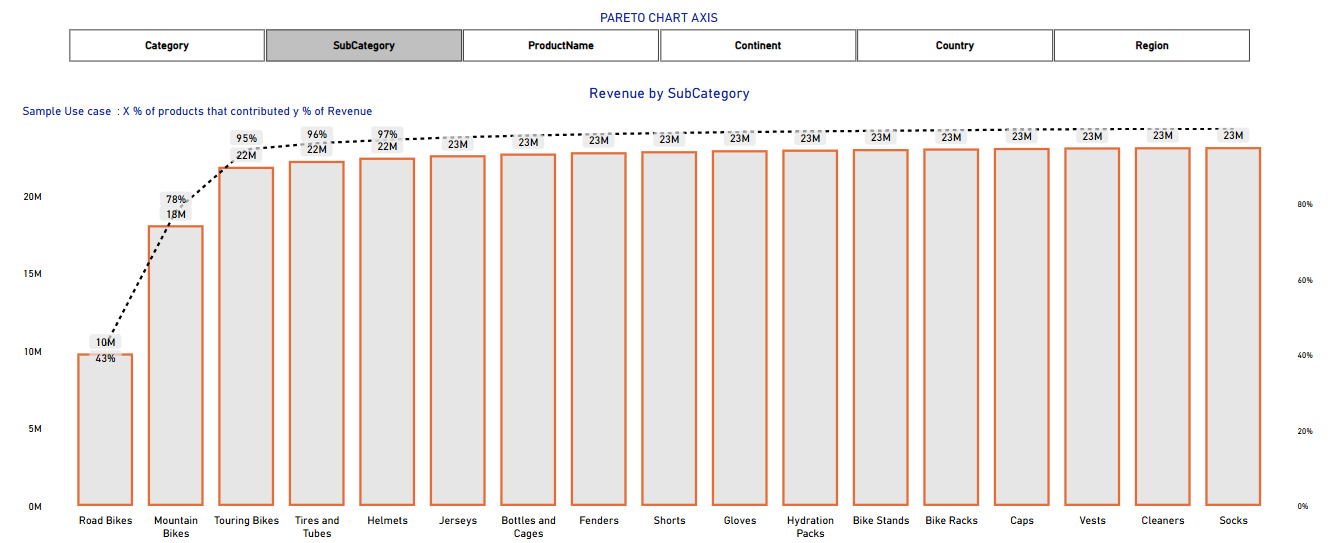
- Top 3 Subcategories namely Road Bikes (10M or 43%), Mountain Bikes (8M or 35%), and Touring bikes (4M or 17%) account for 22M or 95% of Total Revenue
Following functionalities available:
- Dynamic Parameters enabling KPI selection
- This Year YTD vs Last Year YTD KPI Comparisons
- Timeseries (Drilldown from Fiscal Quarter -> Month -> Week) indicating YoY KPI declines
- Two interactive tables with dynamic dimension axis enabling drilling down into the root causes of trends
- A dynamic pareto chart which uses the 80-20 principle to identify best sellers
- Interactive Filter pane using bookmarks
Steps to recreate the Sales Analysis:
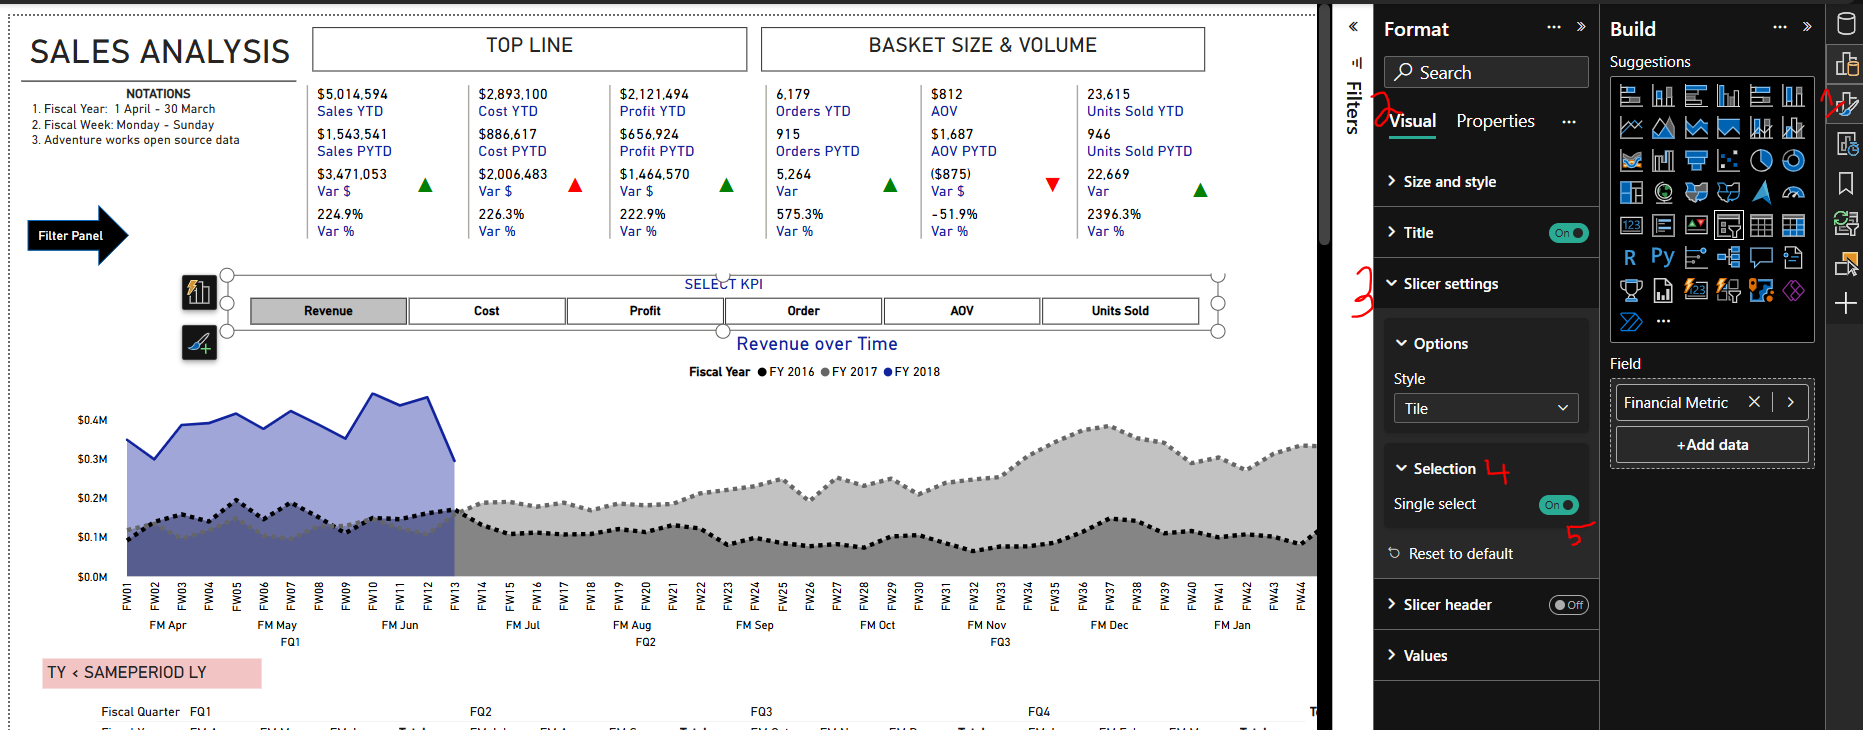
METRIC FIELD PARAMETER
- Step 1 : Create a KPI Field Parameter:
Either using the code below
Financial Metric = {
    ("Cost", NAMEOF('Key Measures'[Total Cost]), 1),
    ("Revenue", NAMEOF([Total Revenue]), 0),
    ("Profit", NAMEOF([Total Profit]), 2),
    ("Order", NAMEOF([Orders]), 3),
    ("AOV", NAMEOF([AOV]), 4),
    ("Units Sold", NAMEOF([Units Sold]), 5)
}
OR, Using the “Modeling” Ribbon -> “New Parameter” -> “Fields” -> Select the fields i.e. Cost, Revenue, Profit etc.
- Step 2 : Create a slicer with the Financial Metric and enable “Single select” from the “Format” Pane -> “Slicer settings” -> “Options” -> “Selection”
This Year YTD vs Last Year YTD KPI Comparisons
Date Table Configuration to ensure:
- Fiscal Year: 1 April - 30 March
- Fiscal Week: Monday - Sunday
VAR FirstFiscalMonth = 4       -- First month of the fiscal year
VAR FirstDayOfWeek = 1         -- 0 = Sunday, 1 = Monday, ...
VAR FirstSalesDate = MIN ( Sales[Order Date] )
VAR LastSalesDate = MAX ( Sales[Order Date] )
VAR TypeStartFiscalYear = 1     -- Fiscal year as Calendar Year of :
                                -- 0 - First day of fiscal year
                                -- 1 - Last day of fiscal year
VAR QuarterWeekType = "445" -- Supports only "445", "454", and "544"
VAR WeeklyType = "Nearest" -- Use: "Nearest" or "Last"
Create the measures below for the KPI Card
Sales YTD = IF (
    [ShowValueForDates],
    VAR LastDayAvailable = MAX ( 'Date'[Day of Fiscal Year Number] )
    VAR LastFiscalYearAvailable = MAX ( 'Date'[Fiscal Year Number] )
    VAR Result =
        CALCULATE (
            [Total Revenue],
            ALLEXCEPT ( 'Date', 'Date'[Working Day], 'Date'[Day of Week] ),
            'Date'[Day of Fiscal Year Number] <= LastDayAvailable,
            'Date'[Fiscal Year Number] = LastFiscalYearAvailable
        )
    RETURN
        Result
)
Sales PYTD = IF (
    [ShowValueForDates],
    VAR PreviousFiscalYear = MAX ( 'Date'[Fiscal Year Number] ) - 1
    VAR LastDayOfFiscalYearAvailable =
        CALCULATE (
            MAX ( 'Date'[Day of Fiscal Year Number] ),
            REMOVEFILTERS (               -- Remove filters from
                'Date'[Working Day],      -- filter-safe columns
                'Date'[Day of Week],      -- to get the last day with data
                'Date'[Day of Week Number] -- selected in the report
            ),
            'Date'[DateWithSales] = TRUE
        )
    VAR Result =
        CALCULATE (
            [Total Revenue],
            ALLEXCEPT ( 'Date', 'Date'[Working Day], 'Date'[Day of Week] ),
            'Date'[Fiscal Year Number] = PreviousFiscalYear,
            'Date'[Day of Fiscal Year Number] <= LastDayOfFiscalYearAvailable,
            'Date'[DateWithSales] = TRUE
        )
    RETURN
        Result
)
Sales YOY =
VAR ValueCurrentPeriod = [Total Revenue]
VAR ValuePreviousPeriod = [Sales PY]
VAR Result =
    IF (
        NOT ISBLANK ( ValueCurrentPeriod )
            && NOT ISBLANK ( ValuePreviousPeriod ),
        ValueCurrentPeriod - ValuePreviousPeriod
    )
RETURN
    Result
Sales YOY % = DIVIDE (
    [Sales YOY],
    [Sales PY]
)
Timeseries (Drilldown from Fiscal Quarter -> Month -> Week) indicating YoY KPI declines.
- Code for the YoY Metric Variance
  Metric YoY Var =

SWITCH( [MetricVal],
    "Cost", [Cost YOY],
    "Revenue", [Sales YOY],
    "Profit", [Profit YOY],
    "Order", [Orders YOY],
    "AOV", [AOV YOY],
    "Units Sold",[Units Sold YOY]
)
- Code for the Conditional Formatting Measure applied to the YoY Metric Variance measure in the matrix
  Metric YoY Var =

SWITCH( [MetricVal],
    "Cost", IF( [Cost YOY] > 0 ,"#F2C4C4" ),
    "Revenue", IF ( [Sales YOY] < 0 , "#F2C4C4" ) ,
    "Profit", IF( [Profit YOY] < 0, "#F2C4C4"),
    "Order", IF( [Orders YOY]<0, "#F2C4C4"),
    "AOV", IF([AOV YOY] < 0, "#F2C4C4" ),
    "Units Sold",IF( [Units Sold YOY] < 0 ,"#F2C4C4")
)
Two interactive tables with dynamic dimension axis enabling drilling down into the root causes of trends.
- Using three field parameters the, two individual parameters for the axis and one for the KPI metric created previously enables this.
- The dynamic headers are created by using the DAX formula “VALUES” to get the selected value from the field parameter
A dynamic pareto chart which uses the 80-20 principle to identify best sellers.
-
The pareto chart is based on two measures which takes into account the selected dimension from the Pareto Parameter
-
The DAX measure for the Running total
RT Metric =
VAR _StateRev =

// find the value of the select KPI

SWITCH( [MetricVal],
    "Cost", [Total Cost],
    "Revenue", [Total Revenue],
    "Profit", [Total Profit],
    "Order", [Orders],
    "AOV", Blank(),
    "Units Sold",[Units Sold]
)

// For each dimension in the pareto parameter, find the running total based on the selected metric

Var _continent=
SUMX(
    FILTER(
        SUMMARIZE ( ALLSELECTED(Sales),dim_Territories[Continent], // selected axis, changes based on the Pareto Parameter value
            "Revenue",
SWITCH( [MetricVal],
    "Cost", [Total Cost],
    "Revenue", [Total Revenue],
    "Profit", [Total Profit],
    "Order", [Orders],
    "AOV", Blank(),
    "Units Sold",[Units Sold]
)
),
                [Revenue] >= _StateRev),
                    [Revenue] )
Var _country=
SUMX(
    FILTER(
        SUMMARIZE ( ALLSELECTED(Sales),dim_Territories[Country],
            "Revenue",
SWITCH( [MetricVal],
    "Cost", [Total Cost],
    "Revenue", [Total Revenue],
    "Profit", [Total Profit],
    "Order", [Orders],
    "AOV", Blank(),
    "Units Sold",[Units Sold]
)
),
                [Revenue] >= _StateRev),
                    [Revenue] )

Var _Region=
SUMX(
    FILTER(
        SUMMARIZE ( ALLSELECTED(Sales),dim_Territories[Region],
            "Revenue",
SWITCH( [MetricVal],
    "Cost", [Total Cost],
    "Revenue", [Total Revenue],
    "Profit", [Total Profit],
    "Order", [Orders],
    "AOV", Blank(),
    "Units Sold",[Units Sold]
)
),
                [Revenue] >= _StateRev),
                    [Revenue] )


Var _Cateogory=
SUMX(
    FILTER(
        SUMMARIZE ( ALLSELECTED(Sales), dim_Products[Category],
            "Revenue",
SWITCH( [MetricVal],
    "Cost", [Total Cost],
    "Revenue", [Total Revenue],
    "Profit", [Total Profit],
    "Order", [Orders],
    "AOV", Blank(),
    "Units Sold",[Units Sold]
)
),
                [Revenue] >= _StateRev),
                    [Revenue] )


Var _subcat=
SUMX(
    FILTER(
        SUMMARIZE ( ALLSELECTED(Sales), dim_Products[SubCategory],
            "Revenue",
SWITCH( [MetricVal],
    "Cost", [Total Cost],
    "Revenue", [Total Revenue],
    "Profit", [Total Profit],
    "Order", [Orders],
    "AOV", Blank(),
    "Units Sold",[Units Sold]
)
),
                [Revenue] >= _StateRev),
                    [Revenue] )


Var _products=
SUMX(
    FILTER(
        SUMMARIZE ( ALLSELECTED(Sales), dim_Products[ProductName],
            "Revenue",
SWITCH( [MetricVal],
    "Cost", [Total Cost],
    "Revenue", [Total Revenue],
    "Profit", [Total Profit],
    "Order", [Orders],
    "AOV", Blank(),
    "Units Sold",[Units Sold]
)
),
                [Revenue] >= _StateRev),
                    [Revenue] )


var _output=
SWITCH( [ParetoParamVal],
    "Country", _country,
    "Continent", _continent,
    "Region", _Region,
    "Category",_Cateogory,
    "SubCategory", _subcat,
    "ProductName",_products
)

RETURN
IF(ISBLANK( SWITCH( [MetricVal],
    "Cost", [Total Cost],
    "Revenue", [Total Revenue],
    "Profit", [Total Profit],
    "Order", [Orders],
    "AOV", Blank(),
    "Units Sold",[Units Sold]
)), blank(),  _output
)
- The DAX Measure for the Running Total %
RT Metric % =
VAR _StateRev =

SWITCH( [MetricVal],
    "Cost", [Total Cost],
    "Revenue", [Total Revenue],
    "Profit", [Total Profit],
    "Order", [Orders],
    "AOV", Blank(),
    "Units Sold",[Units Sold]
)

VAR _ALLSales =

CALCULATE(
SWITCH( [MetricVal],
    "Cost", [Total Cost],
    "Revenue", [Total Revenue],
    "Profit", [Total Profit],
    "Order", [Orders],
    "AOV", Blank(),
    "Units Sold",[Units Sold]
)
, ALLSELECTED(Sales))

/// post

//new

Var _continent=
DIVIDE(
SUMX(
    FILTER(
        SUMMARIZE ( ALLSELECTED(Sales),dim_Territories[Continent],
            "Revenue",
SWITCH( [MetricVal],
    "Cost", [Total Cost],
    "Revenue", [Total Revenue],
    "Profit", [Total Profit],
    "Order", [Orders],
    "AOV", Blank(),
    "Units Sold",[Units Sold]
)
),
                [Revenue] >= _StateRev),
                    [Revenue] ),
    _ALLSales,0)


Var _country=
DIVIDE(
SUMX(
    FILTER(
        SUMMARIZE ( ALLSELECTED(Sales),dim_Territories[Country],
            "Revenue",
SWITCH( [MetricVal],
    "Cost", [Total Cost],
    "Revenue", [Total Revenue],
    "Profit", [Total Profit],
    "Order", [Orders],
    "AOV", Blank(),
    "Units Sold",[Units Sold]
)
),
                [Revenue] >= _StateRev),
                    [Revenue] ),
    _ALLSales,0)

Var _Region=
DIVIDE(
SUMX(
    FILTER(
        SUMMARIZE ( ALLSELECTED(Sales),dim_Territories[Region],
            "Revenue",
SWITCH( [MetricVal],
    "Cost", [Total Cost],
    "Revenue", [Total Revenue],
    "Profit", [Total Profit],
    "Order", [Orders],
    "AOV", Blank(),
    "Units Sold",[Units Sold]
)
),
                [Revenue] >= _StateRev),
                    [Revenue] ),
    _ALLSales,0)


Var _Cateogory=
DIVIDE(
SUMX(
    FILTER(
        SUMMARIZE ( ALLSELECTED(Sales),dim_Products[Category],
            "Revenue",
SWITCH( [MetricVal],
    "Cost", [Total Cost],
    "Revenue", [Total Revenue],
    "Profit", [Total Profit],
    "Order", [Orders],
    "AOV", Blank(),
    "Units Sold",[Units Sold]
)
),
                [Revenue] >= _StateRev),
                    [Revenue] ),
    _ALLSales,0)

Var _subcat=
DIVIDE(
SUMX(
    FILTER(
        SUMMARIZE ( ALLSELECTED(Sales),dim_Products[SubCategory],
            "Revenue",
SWITCH( [MetricVal],
    "Cost", [Total Cost],
    "Revenue", [Total Revenue],
    "Profit", [Total Profit],
    "Order", [Orders],
    "AOV", Blank(),
    "Units Sold",[Units Sold]
)
),
                [Revenue] >= _StateRev),
                    [Revenue] ),
    _ALLSales,0)

Var _products=
DIVIDE(
SUMX(
    FILTER(
        SUMMARIZE ( ALLSELECTED(Sales),dim_Products[ProductName],
            "Revenue",
SWITCH( [MetricVal],
    "Cost", [Total Cost],
    "Revenue", [Total Revenue],
    "Profit", [Total Profit],
    "Order", [Orders],
    "AOV", Blank(),
    "Units Sold",[Units Sold]
)
),
                [Revenue] >= _StateRev),
                    [Revenue] ),
    _ALLSales,0)


// new

//prev

var _output=
SWITCH( [ParetoParamVal],
    "Country", _country,
    "Continent", _continent,
    "Region", _Region,
    "Category",_Cateogory,
    "SubCategory", _subcat,
    "ProductName",_products
)

// return the output based on the selected pareto parameter value
RETURN
IF(ISBLANK( SWITCH( [MetricVal],
    "Cost", [Total Cost],
    "Revenue", [Total Revenue],
    "Profit", [Total Profit],
    "Order", [Orders],
    "AOV", Blank(),
    "Units Sold",[Units Sold]
)), blank(),  _output
)
Historical Version Below:
A quick demonstration and documentation of the solution along with the features mentioned below.
Problem Statements
- Analyze historical sales and profit and territory.
- Identify bestselling products and attributed customers and regions.
- Forecast revenue for the next 7 periods.
- Execute pricing scenario analysis to understand the increase in product cost.
Following functionalities are available:
- Conditional drill-down using 2 columns: Customer ad Region to analyze Profit.
- Dynamic Product Pricing Scenario Analysis.
- Forecast Revenue for the next 7 months+.
- Pareto Chart for Regions and Product Sub Categories. Using the 80-20 Principle to understand best sellers.
- Drill down Territories By Fiscal Year, Customer Details, and (Sub)/Product Categories.
- Page Navigation and Custom Filter Panes.
Click here to download the raw data and the Power BI Solution